Power BI report samples

Power BI report samples — Power BI Operations

Operations & logistics dashboards

3
freelancers
11
views

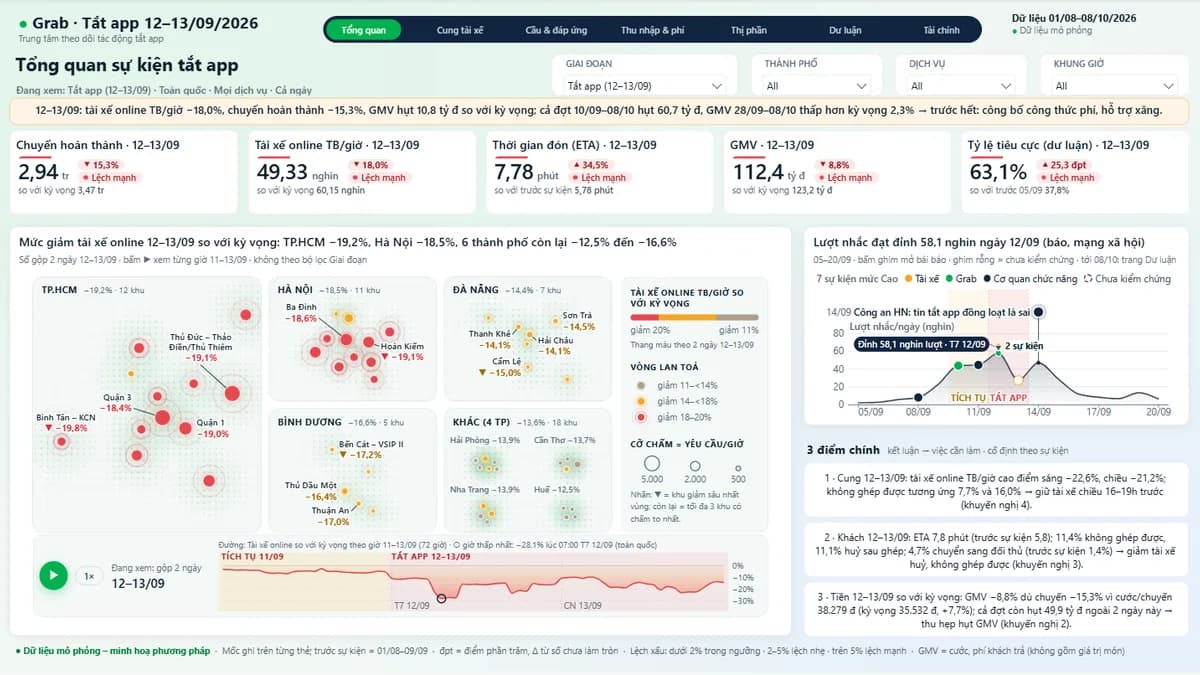
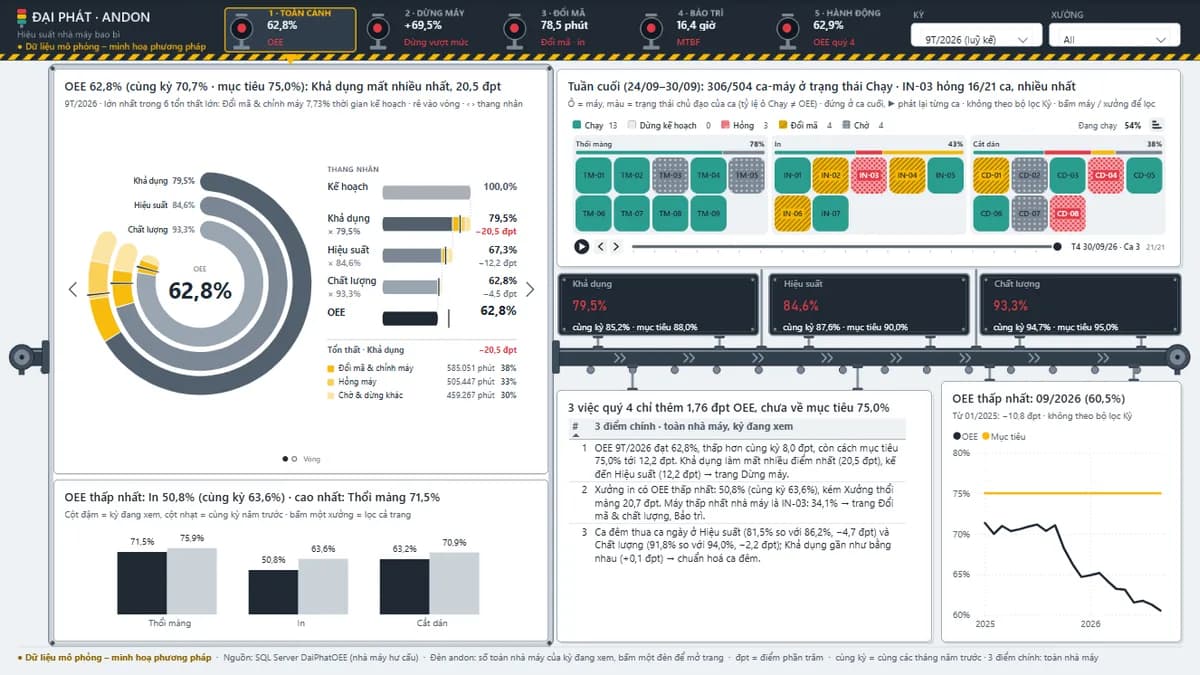
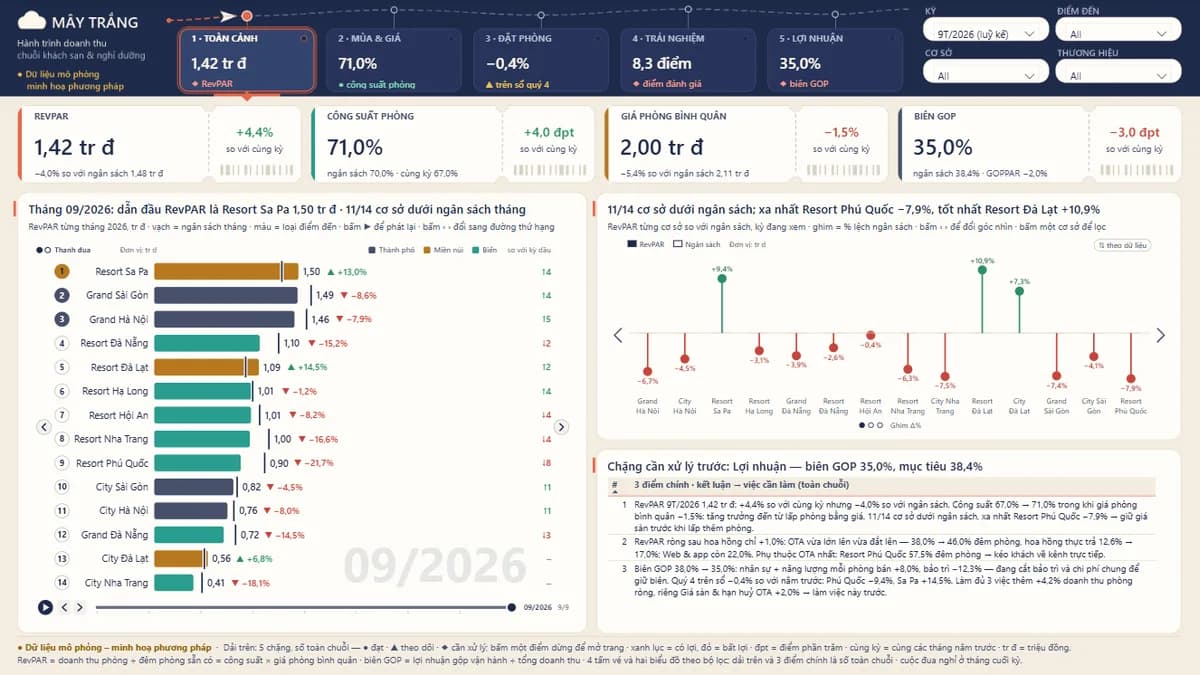
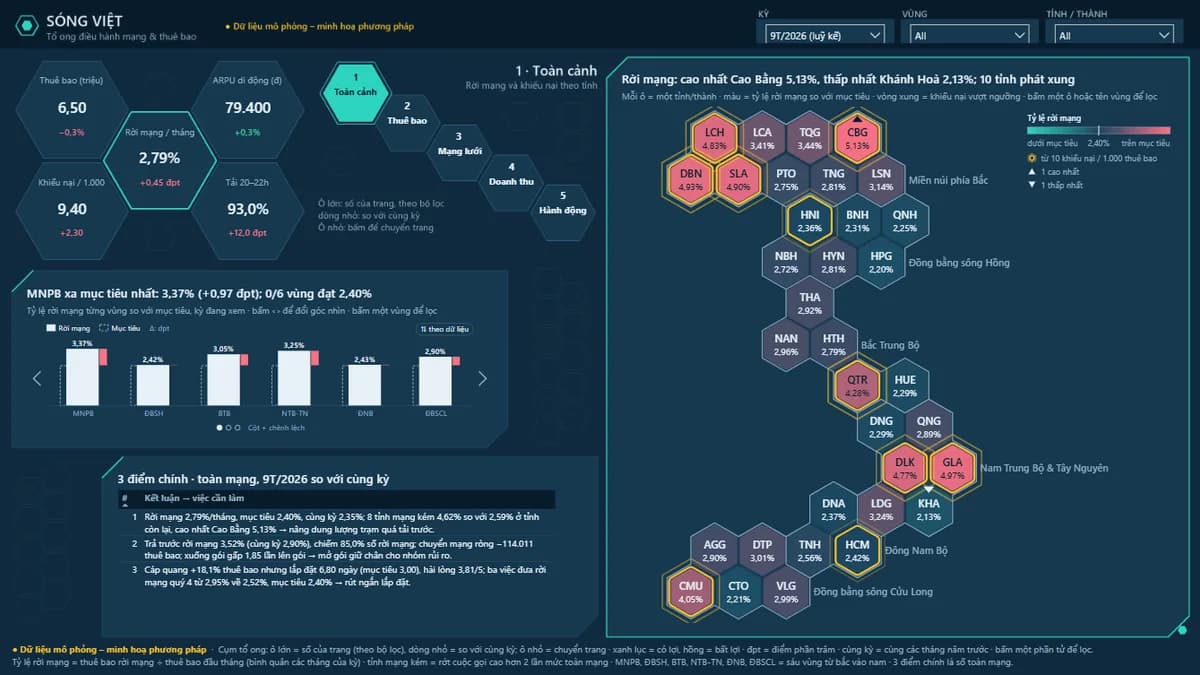
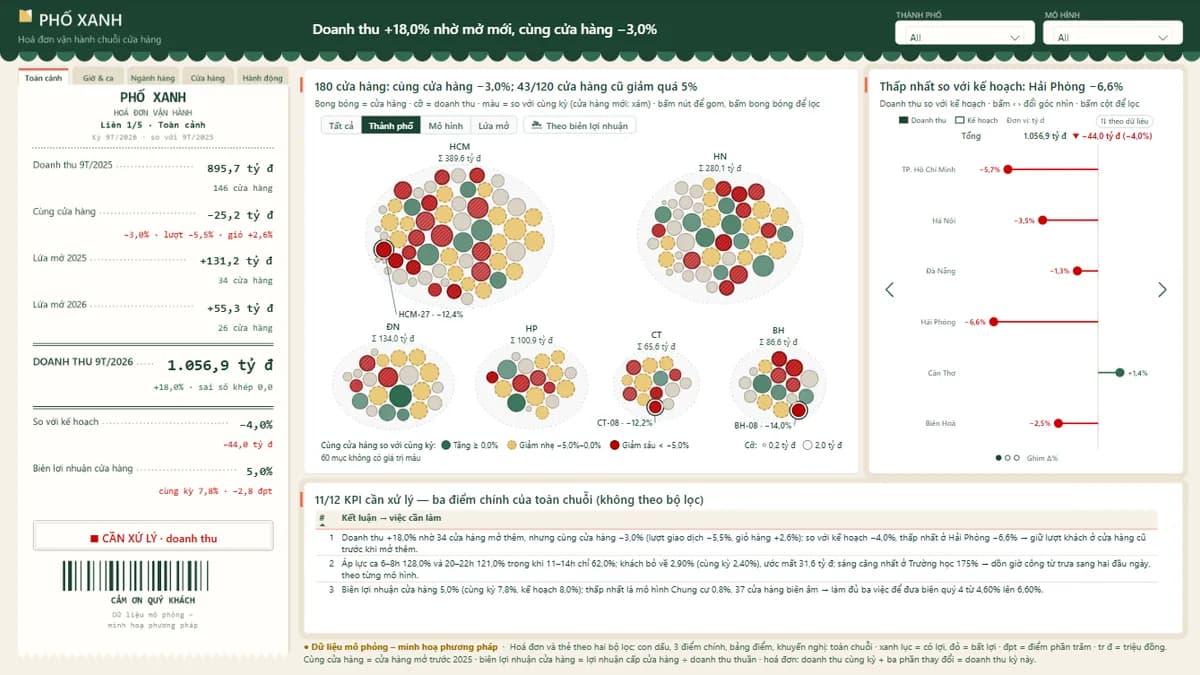
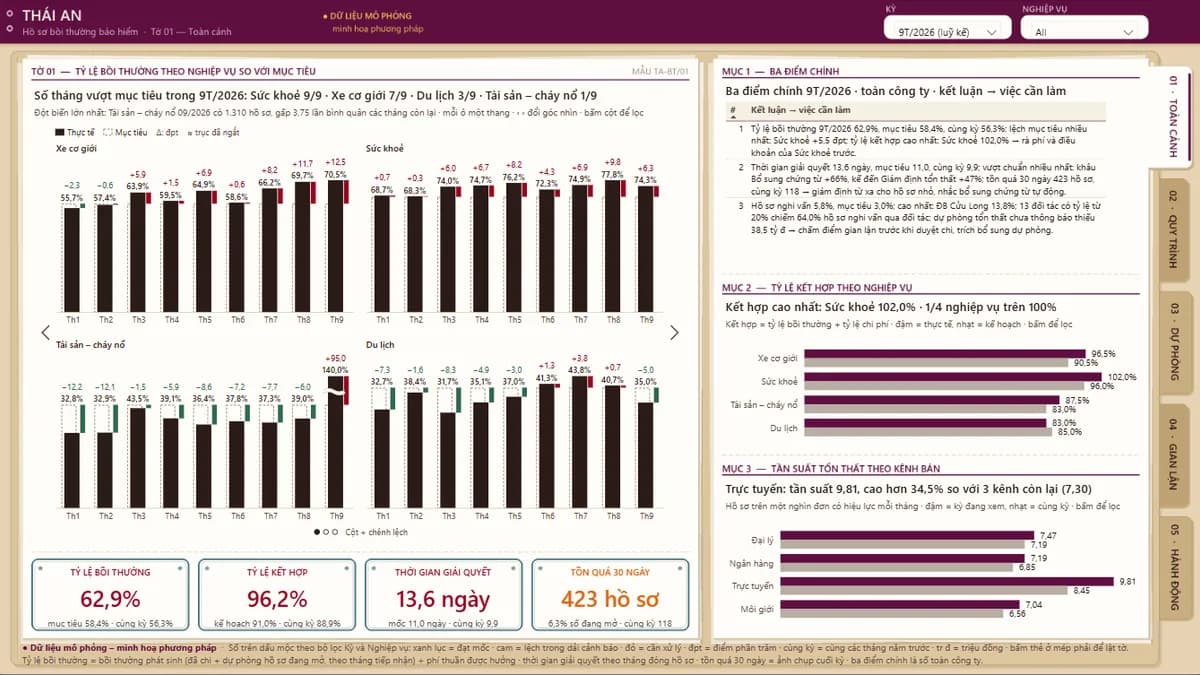
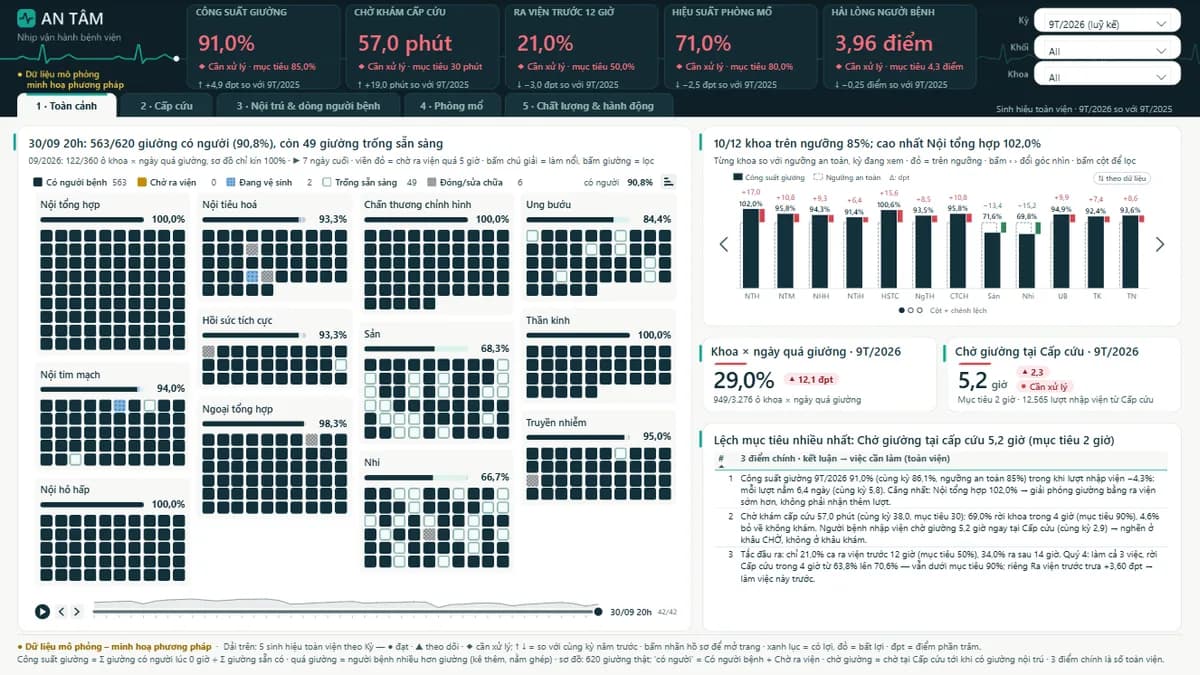
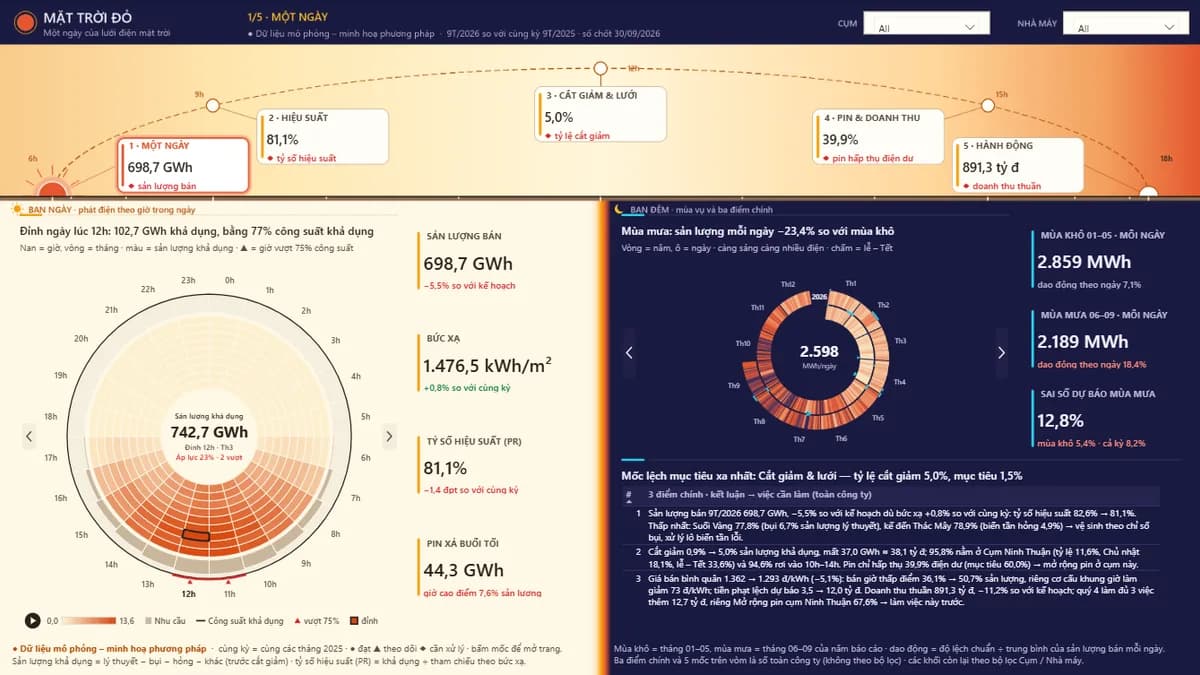
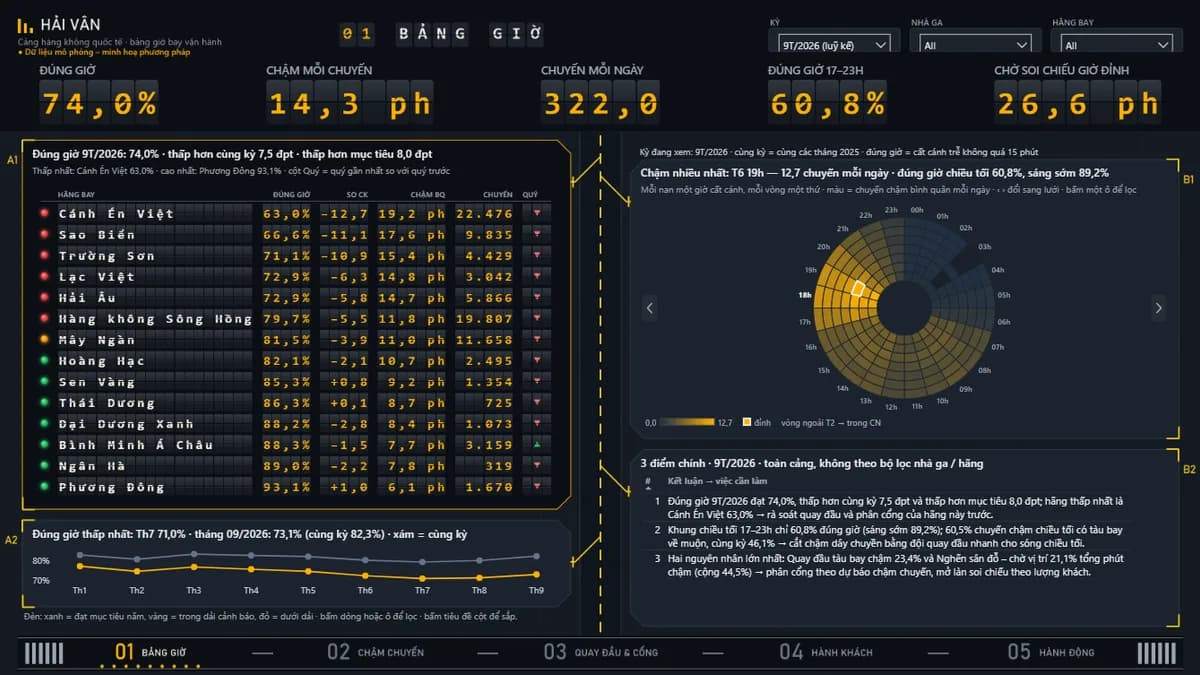
Operations Power BI dashboards help COOs, operations managers, and plant managers monitor process efficiency, capacity utilization, and operational KPIs across departments. Common operations dashboards cover production output, order fulfillment rates, SLA compliance, logistics performance, and cost per unit. These reports replace static weekly Excel updates with live operational visibility — enabling faster decisions when processes drift out of target.

11
Operations report samples
Post a Operations project →

Post free — get proposals from matching freelancers.

View all categories →

11 Operations report samples

Frequently asked questions

What operational data sources can Power BI connect to?
Power BI connects to ERP systems (SAP, Oracle, Microsoft Dynamics), MES systems, SQL databases, IoT sensor data via Azure, Excel/CSV operational reports, and logistics APIs. A freelancer will map your data sources and build the optimal connection strategy.
Can Power BI provide real-time operations monitoring?
Yes. Using DirectQuery against live databases or Azure Stream Analytics for IoT data, Power BI dashboards can update in near real-time. Streaming datasets can push sensor and production line data to a dashboard every few seconds.
What operational KPIs can Power BI track?
Common operational KPIs include: throughput rate, cycle time, defect rate, OEE (Overall Equipment Effectiveness), on-time delivery rate, warehouse picking accuracy, and cost per unit. A freelancer will configure these using DAX measures tailored to your process definitions.
How do I build an SLA compliance dashboard in Power BI?
A freelancer models your ticket or order data with timestamps, compares actual completion times against SLA thresholds, and calculates compliance rates by team, region, and customer tier. Breach patterns become immediately visible in a trend chart.
What is the price for an operations Power BI dashboard?
Reference prices follow SenData's 5 report tiers — Student / practice Power BI report: 200,000 VND – under 500,000 VND; Small / personal report: 500,000 VND – under 1,500,000 VND; Basic business report: 1,500,000 VND – under 3,000,000 VND; Business-wide report: 3,000,000 VND – under 6,000,000 VND; Advanced report / BI system: From 6,000,000 VND — custom quote. Operations dashboards with several data sources, row-level security or system integration usually fall into the advanced tier and are quoted separately. Freelancers quote a concrete price after seeing your data and requirements; see the pricing page for details.

Need a custom operations dashboard for your business?

Post a project + set a price → trusted Power BI freelancers in Vietnam apply (they can propose adjustments if needed). Free to post, pay only when you're happy with the delivered report.

Power BI Report Samples — Operations